Lab 9: Multi-spectral Camera for NDVI
Introduction:
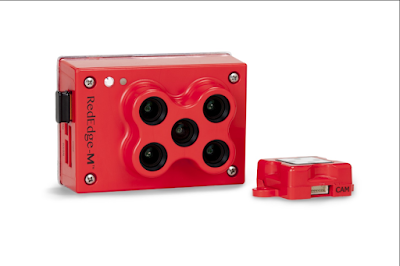
The crux of image analysis is the amount of reflectance collected by each band within a given pixel. The most commonly known bands are Red, Green, and Blue. These bands are most commonly found in digital cameras (cellphones, point and shoot, etc.). The imagery that has been acquired in the past 8 labs have been RGB imagery. However, in this survey we collect imagery in Red, Green, Blue, NIR, and Red Edge bands using the RedEdge M camera built by Micasense (Figure 1.)
Figure 1. Red Edge M camera by Micasense
Imagery collected in these bands allows us to create Normalized Difference Vegetation Index (NDVI) maps. Examining a vegetation's spectral profile allows surveyors to assess its health. All vegetation have similar spectral profiles, however the difference between healthy vegetation and stressed vegetation can be found in the Red, Red Edge, and NIR bands (Figure 2).
Figure 2. Healthy vegetation and stressed vegetation spectral profile
Chlorophyll within vegetation absorb red wavelength and reflect NIR wavelength. Therefore, in healthy vegetation (vegetation that contains large amounts of chlorophyll) there is a plummet in red reflectance and a large spike in NIR relfectance.
The Red Edge camera is a narrow band multi-spectral camera. It is a step about normal, modified multi-spectral camera because it is able to capture very narrow, specific bands that is able to allow the surveyor to capture small differences within reflectance to distinguish between healthy and stressed vegetation. The Red Edge band allows surveyors to capture the plummet of the red band and the narrow spike of the NIR band. This is an advantage over the wide, single red band.
NDVI is most commonly used for industrial agricultural purposes. Fields are before crops are watered and fertilized. An NDVI map is created to show the farmer where healthy and stressed vegetation is located. This data is plugged into a smart tractor and resources are more efficiently allocated. This is allows the farmer to use less resources and prevents excess phosphorus and nitrogen from running into our watersheds.
Study Area:
Figure 3. Holland Sand Prairie, Holmen, WI
- Holland Sand Prairie
- Holmen, WI
- 24 acres
- Land consists of mostly prairie over sandy soil; some woodland does exist in the southwest corner
Data Collection:
- UAS used:
Figure 4. BirdsEyeView Firefly 6 Pro
- Camera used: Micasense Red Edge M (Figure 1)
- Bands
- Green
- Blue
- Red
- Red Edge
- NIR
- GCPs
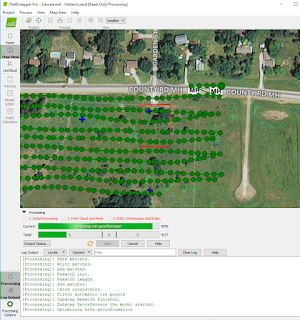
- Only one was used for processing area (Figure 5)
Figure 5. Processing area; singular GCP
Figure 6. Geolocation Accuracy
Methodology:
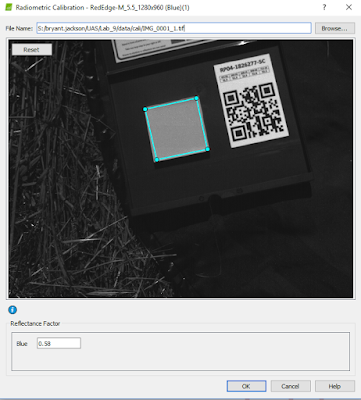
- Before the images are processed each band needs to be calibrated using the calibration reflectance panel
- Each band will have a reflectance value. After drawing a box within the reflectance panel, the individual reflectance value within each band will be plugged in
Figure 7. Radiometric reflectance calibration
- After calibrating the reflectance, the template and outputs of the processing will be specified. This is shown below (Figure 8)
Figure 8. Processing template
Results:
Outputs
Using the Red Edge M narrow band multi-spectral camera we were able to create a a highly detailed NDVI map. This data is able help us monitor the health of the prairie at this moment but across time because of the installation GCPs. This can help us study the relationship between vegetation health and growing season/time of the year, which can ultimately help us answer questions about climate change and its effect on vegetation growth. Finally, this practice can largely be applied to agriculture and the conservation of resources in an effort to clean our water resources.


