Lab 0: Introduction to eCognition
Jackson Radenz
Advanced Remote Sensing
1/23/2018
Introduction
Remote Sensing:
Remote Sensing is the ability to collect data about the surface of the earth without actually needing to be in contact with it. The technique of Remote Sensing can be achieved through the use of satellite systems, UAS, or airplanes which are equipped with RADAR, LIDAR, and multi spectral cameras as sensors which then can be used to collect detailed data about the surface of the earth. Each material on the surface of the earth gives off different amounts of radiance with corresponding wavelengths. In Remote Sensing, we are able to interpret these radiance values using multi spectral cameras enable to analyze the remotely sensed collected imagery.
Spectral Responses of Various Surfaces on the Earth:
Radiance is the amount of energy received by the sensor from the materials on the Earth. Irradiance is the amount of energy the area being remotely sensed is receiving as a whole. From these two values, we are able to create an equation (radiance/irradiance), which will give us reflectance.
Figure 1. spectral responses of various materials on the earth
Figure 1 shows that conifers reflect high amounts of 0.7-1.0 um wavelength relative to soil and water. This discrepancy allows us to distinguish between different features on the earth using remote sensing.
Objective:
Lab_0 will allow us to become more familiar with eCognition. We will be mixing layer properties, changing image equalisations, splitting the screen, and becoming more familiar with the technology. This will not only allow us to become more familiar with the program, but it will help us understand different techniques in interpreting and analyzing different surfaces on the earth.
Method:
- Open eCognition Developer
- Click on 'Load and Manage Data View'
- 'New Project'
- 'Load' image 'orthl7_20423xs100999.img'
- Select 'Subset Selection' in 'Layer Properties'
- Subset minimum and maximum x and y values to the values listed in Figure 2

Figure 2. Subset Selection
- Click OK and create your project
- Select 'Develop Rulesets' option 4 on the viewer tab
- Next, select 'Edit Image Layer Mixing'
- This tab allows us to experiment with the layer properties and change image equalization (Figure 3)

Figure 3. Edit Image Layer Mixing tab
- Manipulate layer mixing to further understand spectral responses of various surfaces on the earth
- Next, generate image equalizations using the 'Equalizing' pull-down tab
Data:
- Image file used for this exercise 'orthl7_20423xs100999.img'
- Image file collected from Landsat 7
- 25 meter spatial resolution
Results:

Figure 4. Original True Color Composite
Figure 4 is the True Color Composite Image. The color blue has been assigned to band 1, green to band 2, and red to band 3. This is what our eyes perceive and multi-spectral sensors receive from the earth's surface. By analyzing the True Color Composite image I am able to understand the different surfaces that exist in the image before I begin to manipulate them.

Figure 5. NIR Band (Band 4) was assigned to the red color, and the blue color was assigned to the Red Band (Band 3).
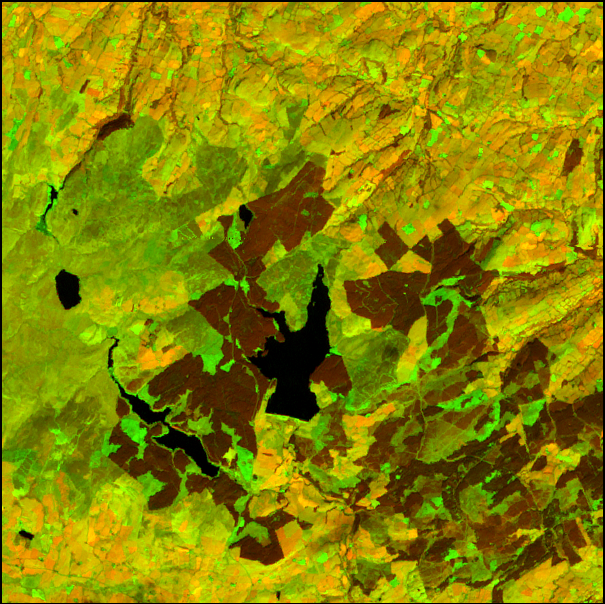
Figure 6. NIR Band (Band 4) was assigned to the red color, and the green color was assigned to SWIR 1&2 (Bands 5&6)

Figure 7. Standard Deviation Equalization

Figure 8. Gamma Ray Correction Equalization
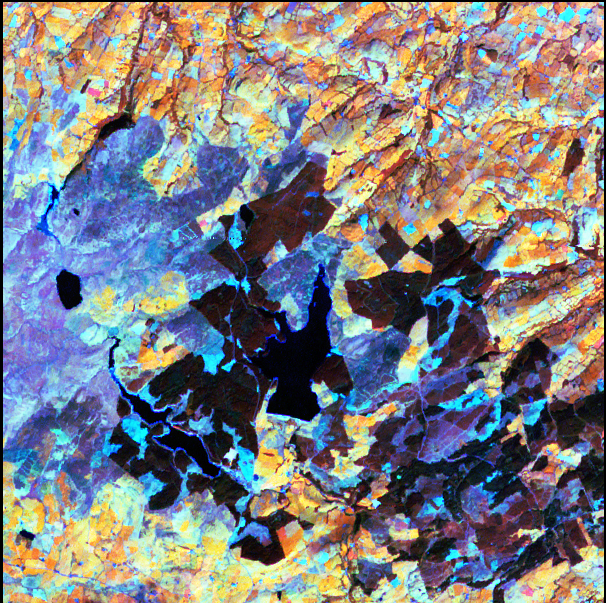
Figure 9. Histogram Equalization
Discussion:
Figure 6 was best at visually interpreting the land cover/land use properties. By assigning the green color to SWIR 1&2 soil and impervious surface were able to stand out the best. Soil has a high Short Wave Infrared wavelength spectral response. Therefore, the colors that are bright green is most likely soil or impervious surface. Not only that, but because I assigned the NIR band to the color red the areas of dense vegetation showed up in the image as a dark red/brown color. Easily distinguishing the land cover from the rest of the image. Medium vegetation/grassland has high responses to NIR and SWIR bands because soil is able to be sensed by the satellite, whereas dense vegetation blocks the soil through canopy cover. We can conclude that grassland and medium vegetation is the orange colors in the image.
Figure 7, Histogram Equalization, was the best at visually interpreting and distinguishing land cover/land use properties. There was much greater contrast in the image. The dense vegetation became very dark, the impervious surface and bare soil became very blue, and the medium vegetated areas/croplands became shades of orange.
Conclusion:
I think eCognition developer can be a very useful program in the use of remote sensing. Once getting to know where everything is in eCognition, it becomes a very easy program to operate. The sky is the limit for the capabilities of the program. Humans see everything as objects, not pixels. That is why I believe this program has so much power, because the program is able to separate various items on the earth's surface into objects based on their features. Not only that, but we add the number of 'bands' to the image by separating the image into objects. That allows the producer to more accurately produce classes. Not only will the producer will be more accurate, but it allows them to create more detailed classes, as well. This is why eCognition stands out from the other GIS software programs that I have used. ArcMap is unable to do any of these capabilities. In ArcMap we would need to single handily digitize objects, which would take an incredibly long time. Also, ENVI classifies an segments an image at a per pixel basis, because of this ENVI has the tendency to run into the salt and pepper problem.