Lab 8: Volumetric Change Detection
Introduction:
Today, the distribution and obtainment natural resources are at a premium. An example of this practice is the distribution of sand and gravel within mines. The mining of sand and gravel has become the largest mining business in the United States. Large amounts of sand and gravel are excavated from stream channels, which are a convenient source of high-quality aggregate that are stored within quarries and mines (Madle, 1974). The productivity measurement challenges in mining are different in several important respects from those in other sectors. Understanding the nature of mining activity, and in particular the nature of capital investment, is one key to understanding the factors that determine mining’s productivity ‘profile’ (Topp et. al, 2008). In order to understand the mine’s productivity ‘profile’ the influx of resources must be monitored throughout time.
With the evolution of surveying technologies the demand for accuracy and precision in earthwork volume calculation has become utmost important (Hamzah & Said, 2011).
Volumetric change detection (geomorphic change detection) is incredibly important to the scientific field, as well. One of the reasons geomorphic change detection is studied is to examine sediment deposition or erosion within rivers and floodplains.
Volumetric change detection is done by subtracting DEMs between two different time periods. When the newest DEM is subtracted by the older DEM creating a DoD (DEM of Difference).
Study Area:
DEM data was derived from an area in Scotland, United Kingdom. A river ran through this area and sediment was deposed here during times of slow flow. When flow began to pick up, sediment would become eroded away from the area and flushed further downstream.
Methodology:
- Open Geomorphic Change Detection tool and start a new project
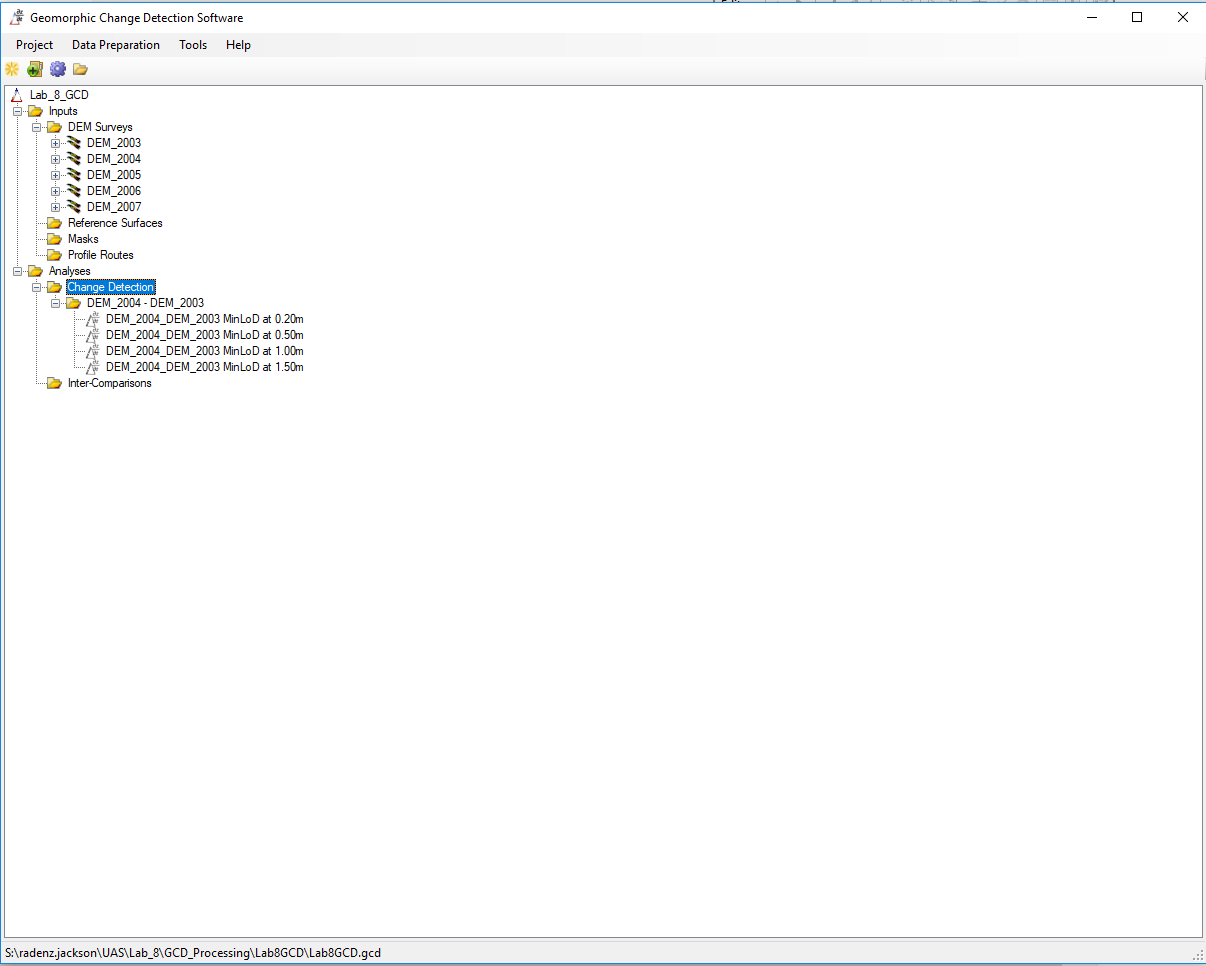
Figure 1. Opening page of Geomorphic Change Detection with added data
- Add DEM survey

Figure 2. Added DEM Survey
- Create a new DoD
- Subtract the new DEM by the old DEM

Figure 3. DoD creation
- After DoD is created tabular and graphical data are created

Figure 4. Tabular DoD results

Figure 5. Graphical results
- Creation of DoDs can also be batch processed

Figure 6. Batch processing of DoD creation
- DoDs were created from surveys from the years': 2003, 2004, 2005, 2006, 2007
Results:

Figure 7. Net volume differences across surveys

Figure 8. DoD from 2003 - 2007 surveys
Discussion:
- As the threshold got larger, the net volume differences became smaller. Therefore, the largest threshold is not the most optimal. The reason for using a threshold would be to rid the DoD of change due to noise or inaccuracy. However, noise or inaccuracy would of 1.5 m would be grossly over estimating the change.
- Therefore, I believe 1 m to be the best threshold. I believe this because the resolution is 1 x 1 m. Therefore, if there is any inaccuracy the data would be off by at least 1 pixel. However, I don't estimate there being larger than 1 m of noise or error. I would like more information regarding the error within each survey